The Splunk integration with Lumeta requires the installation of two files and the addition of a Lumeta input. Both of these are performed on your Splunk server.
- Download the two zipped application files (attached to this page) to your local system:
- Unzip them.
Now you are ready to perform the installation in Splunk.
Installing the Lumeta Application in Splunk
To install the Lumeta plug-in to Spunk:
- Log in to your Splunk server.
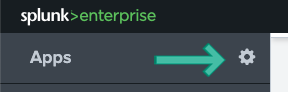
- Select the Manage Apps (gear) icon.
- In the upper right corner, click Install App from File.
- Browse to TA-lumeta.? and upload it.
- When prompted, click Restart Now.
- Repeat steps 3 - 6, this time with lumeta-app. You will not need to restart the system with lumeta-app upload.
Lumeta Apps display.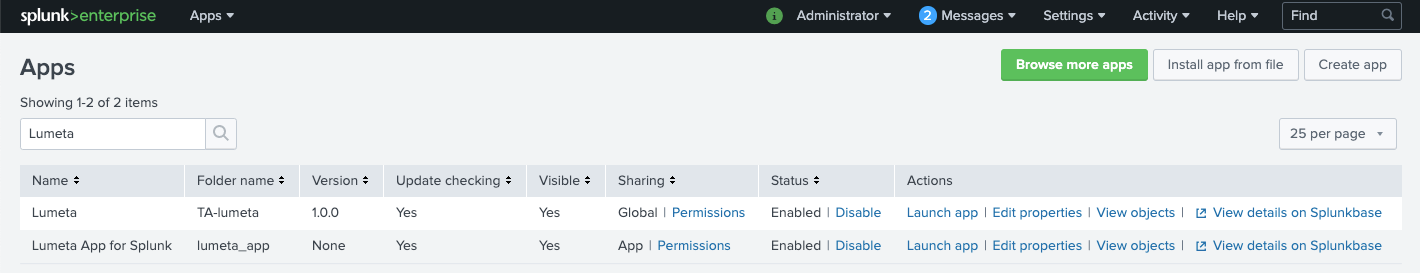
Configuring the Lumeta Application in Splunk
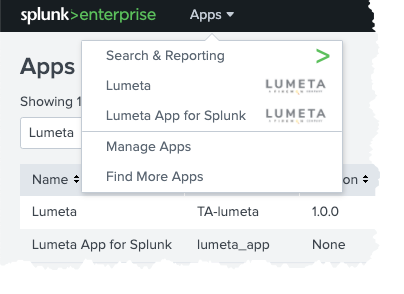
- On the Apps menu, select Lumeta to manage its data inputs.
- Click Create New Input.
- Complete the form
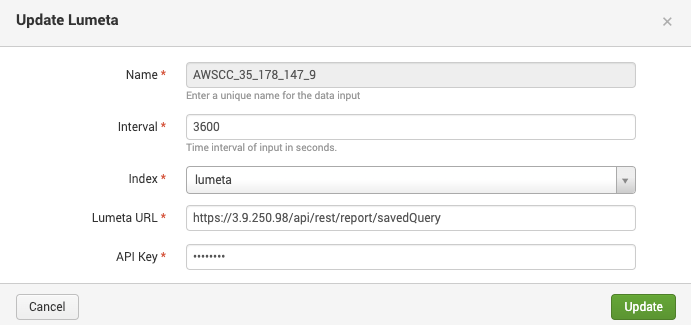
- Name the input. It's a good idea to include the Command Center IP and Port number (9997) in the input name.
- The polling Interval is in seconds
- The Index is lumeta
Add the Lumeta URL:
IF the Command Center is in. . . THEN . . . Example A cloud network (e.g., AWS, Azure) Supply Public IP of Command Center An on-premises/private network Supply the firewall address https://65.246.245.110/api/rest/report/savedQuery The connection is made and the new input is added to the list:
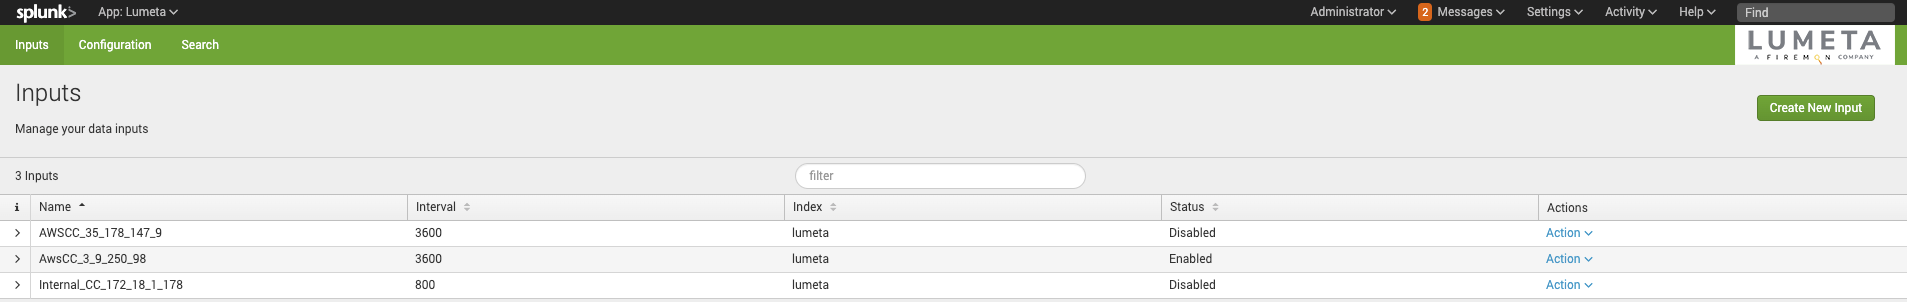
Select Action > Enable to power on the connection.
View Select syslog Data
To search syslog data from Lumeta in Splunk:
- On the Splunk Apps page, select Lumeta App for Splunk.
- Select the Search tab (if you are not there already).
- Enter your search criteria. Examples follow:
- source=”tcp:9997”
- index=lumeta
- sourcetype=”lumeta_log_parser”
- now combine all 3 into one search
- index=lumeta sourcetype=”lumeta_log_parser” source=”tcp:9997”
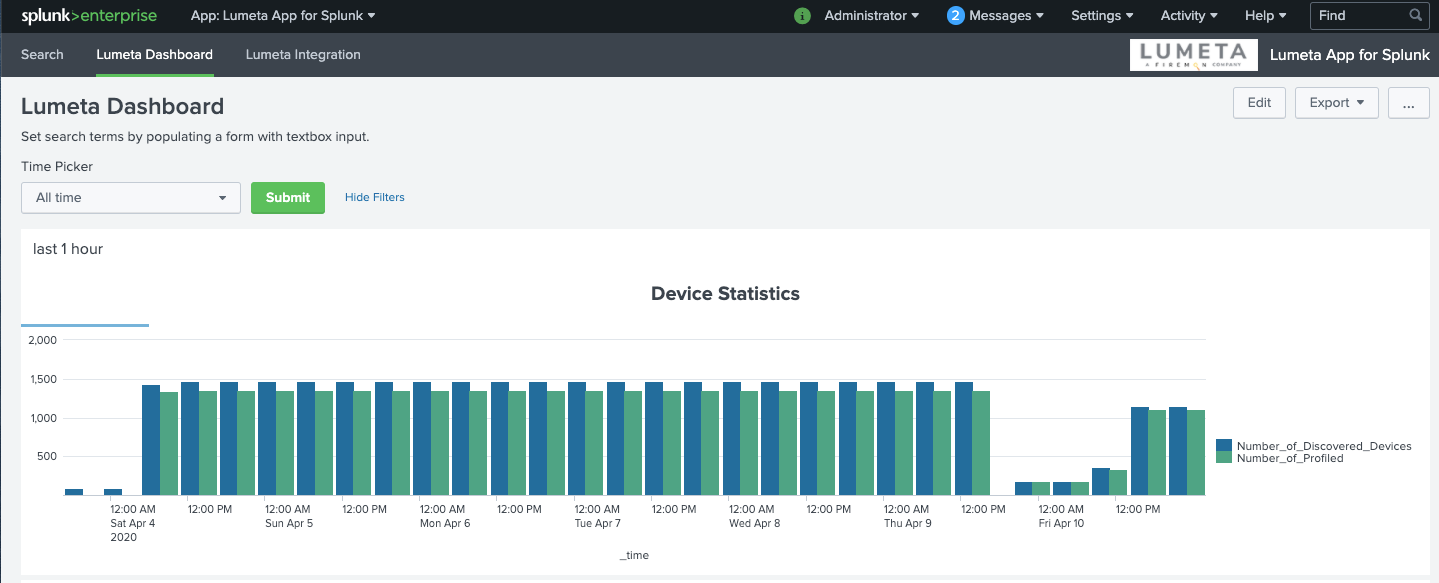
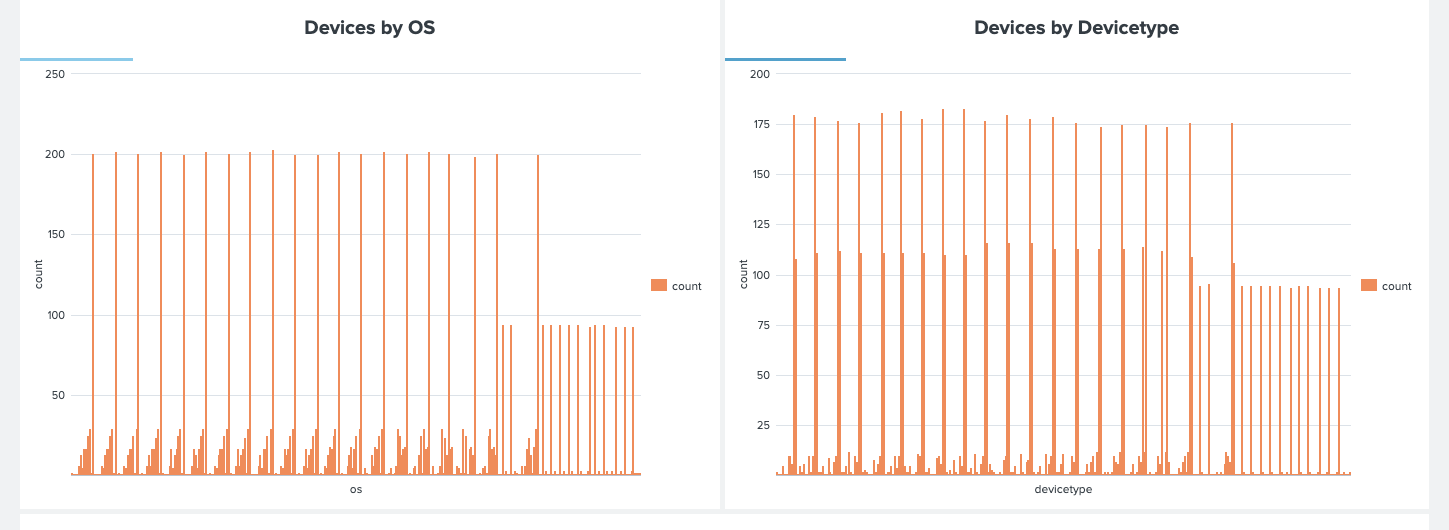
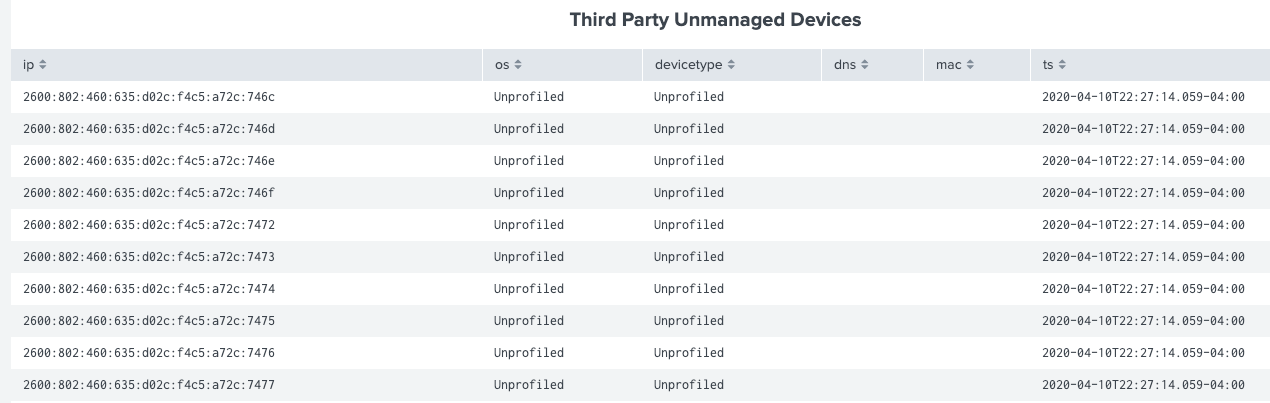
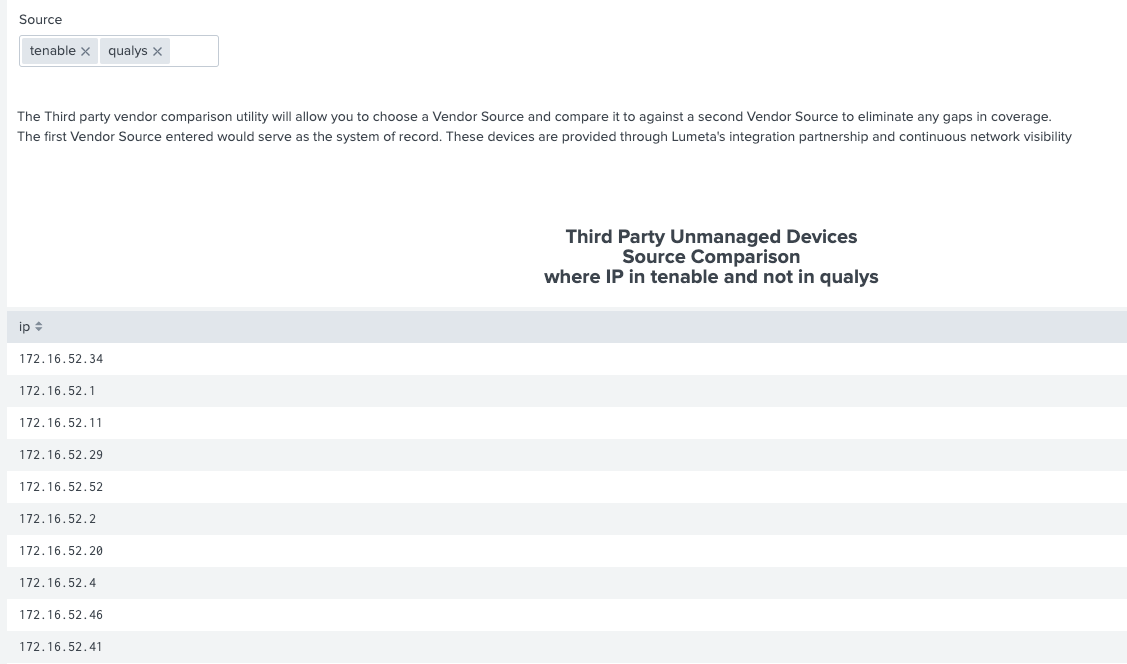
View Dashboards
To view Lumeta dashboards in Splunk:
- On the Splunk Apps page, select Lumeta App for Splunk.
- Click Lumeta Dashboard or Lumeta Integration to view the Dashboards.