Lumeta dashboards provide you with an at-a-glance overview of a zone's operational risk status from a variety of perspectives. They enable you to monitor the health of your network.
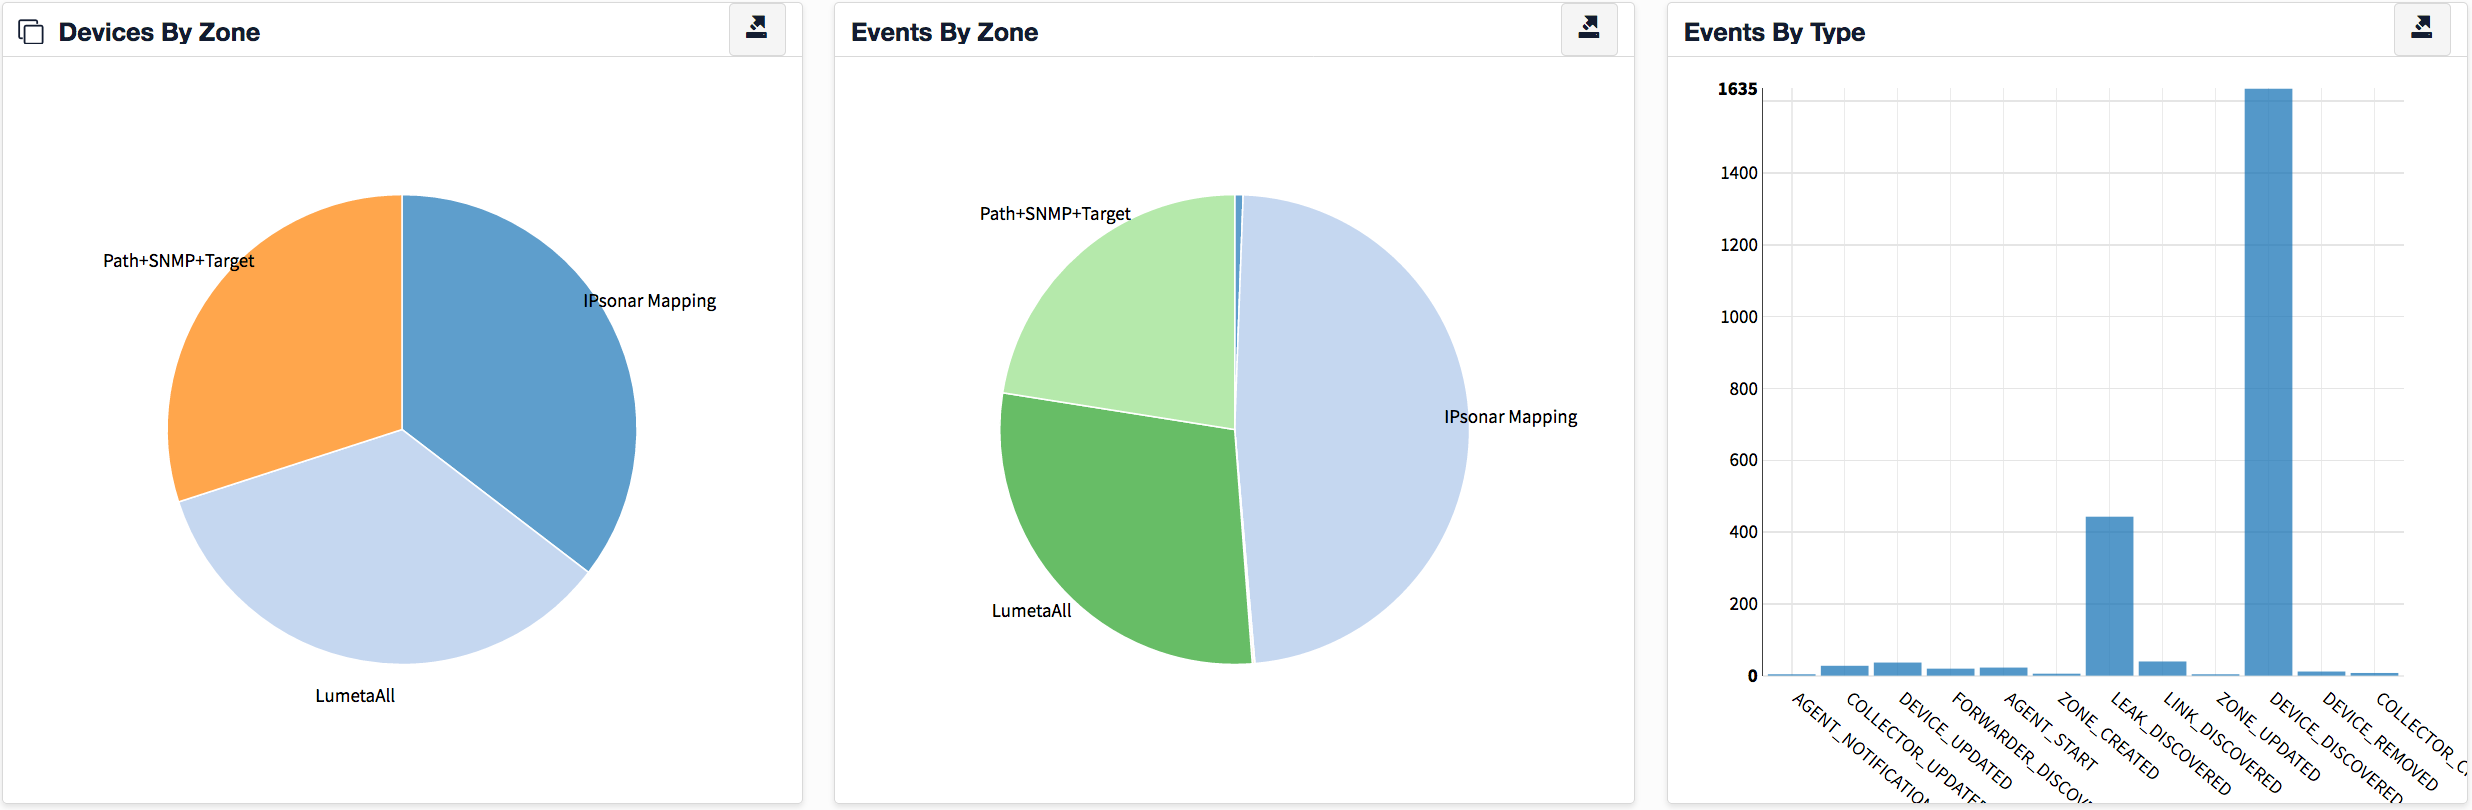
This Indexing Statistics dashboard provides the following information for all Lumeta zones:
Devices by Zone
- Indicates the size of each network zone relative to the whole.
- Indicates the name of each zone you are monitoring.
- Indicates the number of devices present in each zone.
Events by Zone
- Indicates the volume of events triggered for each network zone relative to the whole.
- Indicates the name each zone you are monitoring.
- Indicates the number of events that took place in each zone.
Events by Type
Indicates the frequency with which these events are triggered. Most are benign (e.g., collector_created, agent-stopped). However, if you notice a spike in a single type of event, investigate! If you see license_violations, remediate!
- Lists the most frequent event types occurring across all network zones.
- Shows a visual indication (i.e., bar chart) of events triggered most.
- Indicates the number of events of each type that took place per zone.
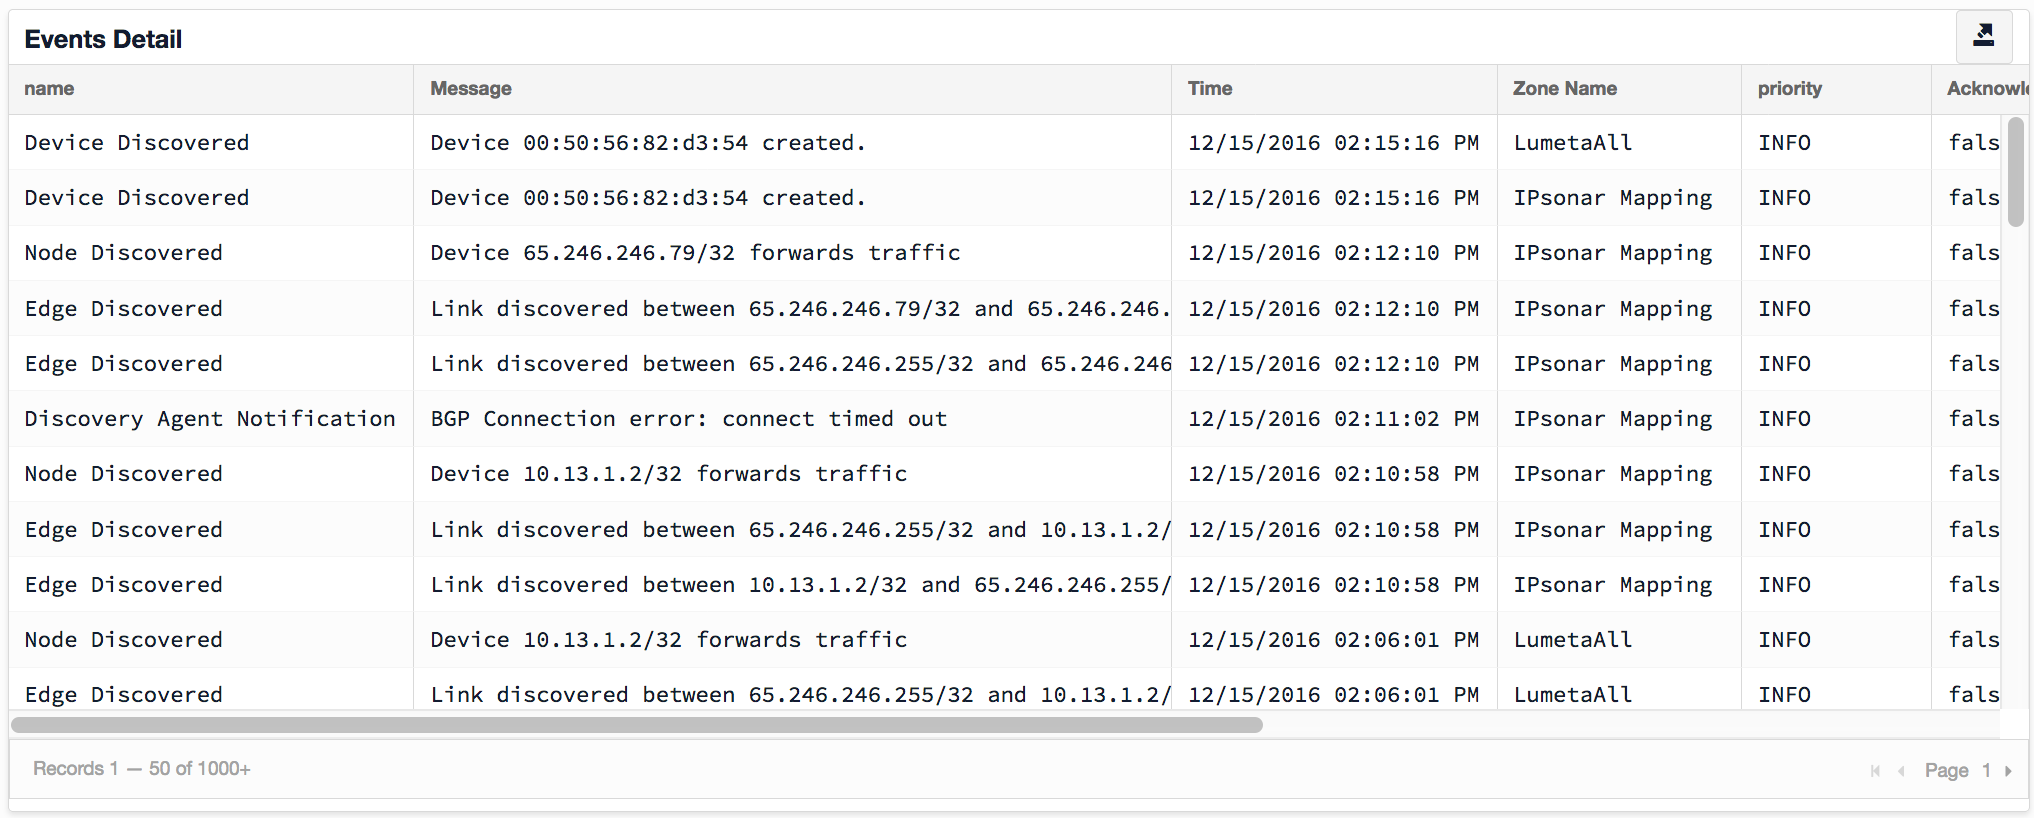
Events Detail
The Events Detail table provides the notification details from which the pie charts are sourced.