To view selected syslog data from Lumeta in Splunk:
- On the Splunk Apps page, select Lumeta App for Splunk.
- Select the Search tab (if you are not there already).
- Enter your search criteria. Examples follow:
- source=”tcp:9997”
- index=lumeta
- sourcetype=”lumeta_log_parser”
- now combine all 3 into one search
- index=lumeta sourcetype=”lumeta_log_parser” source=”tcp:9997”
index=lumeta sourcetype="lumetaapiparser" *|table "Account ID" "Instance ID" "Public IP Address" Provider numberofinterfaces Name Region securitygroupsids{}{} | where numberofinterfaces not null and Provider not null and Name not null and Region not null| rename securitygroupsids{}{} as securitygroupsids
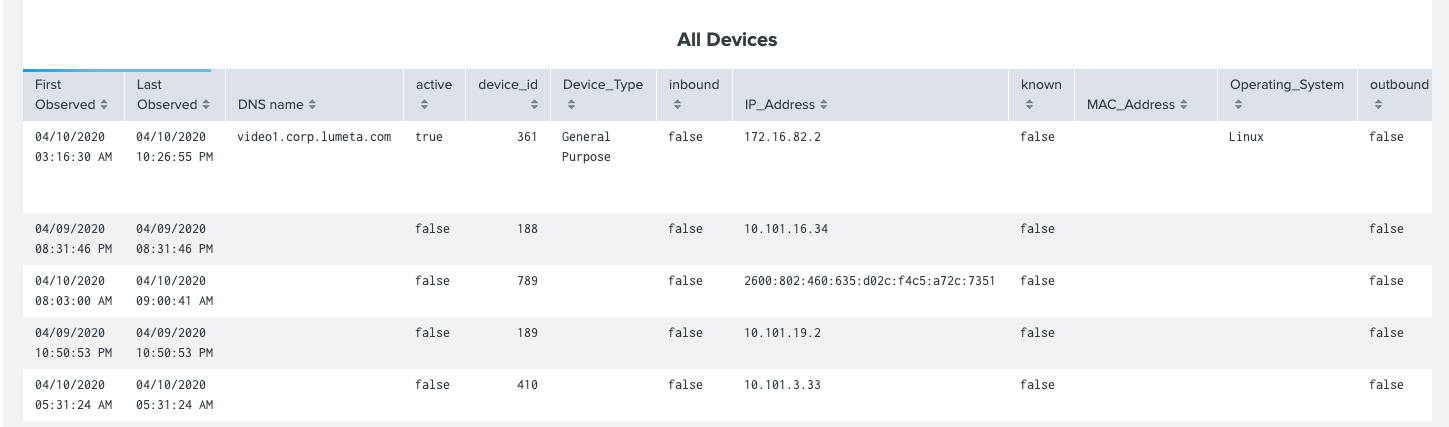
index=lumeta sourcetype=lumetaapiparser * |table "First Observed" "Last Observed" "DNS name" active device_id Device_Type inbound IP_Address known MAC_Address Operating_System outbound scantypes{} protocols{} snmpaccessible snmpresponder target vendor version zoneid zonename| search "First Observed"=* OR "DNS name"=* OR "Last Observed"=* OR active=* OR device_id=* OR Device_Type=* OR inbound=* OR IP_Address=* OR known=* OR MAC_Address=* OR Operating_System=* OR outbound=* OR scantypes{}=* OR protocols{}=* OR snmpaccessible=* OR snmpresponder=* OR target=* OR vendor=* OR version=* OR zoneid=* OR zonename=*
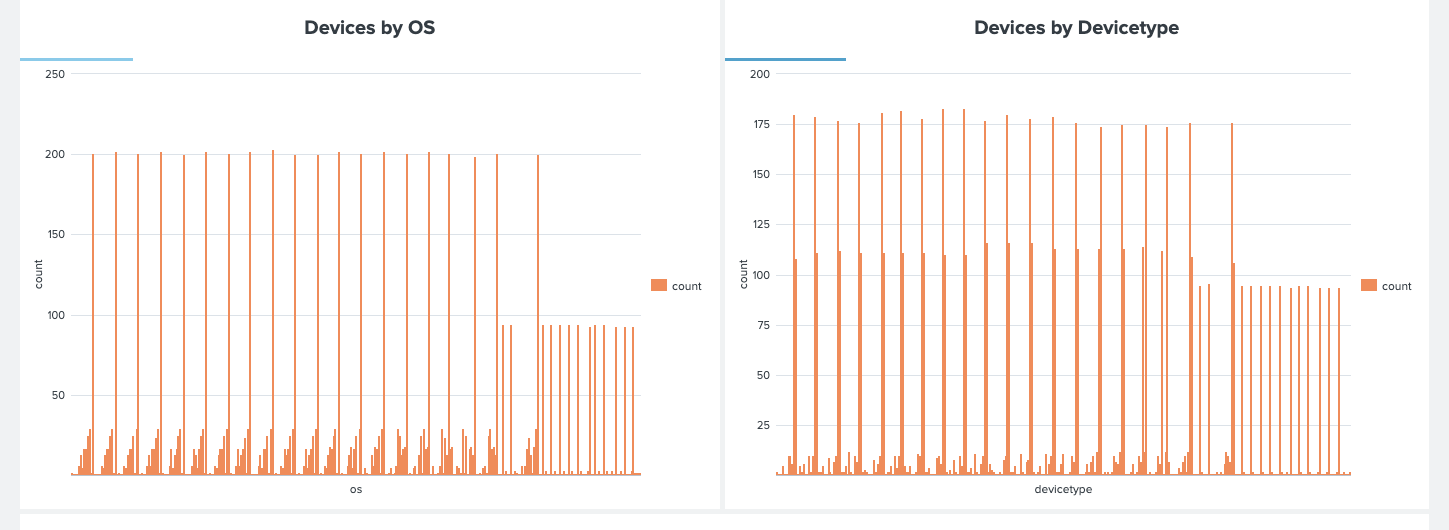
index=lumeta sourcetype="lumetaapiparser" |table os count time| fields - time
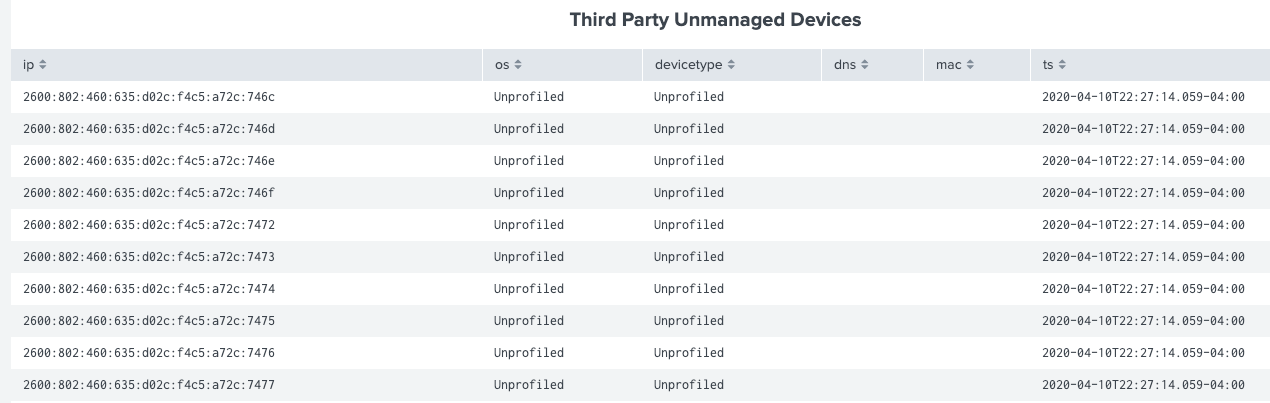
| where count not null and os not nullindex=lumeta sourcetype="lumetaapiparser" * source_name=* | table ip os devicetype dns mac ts
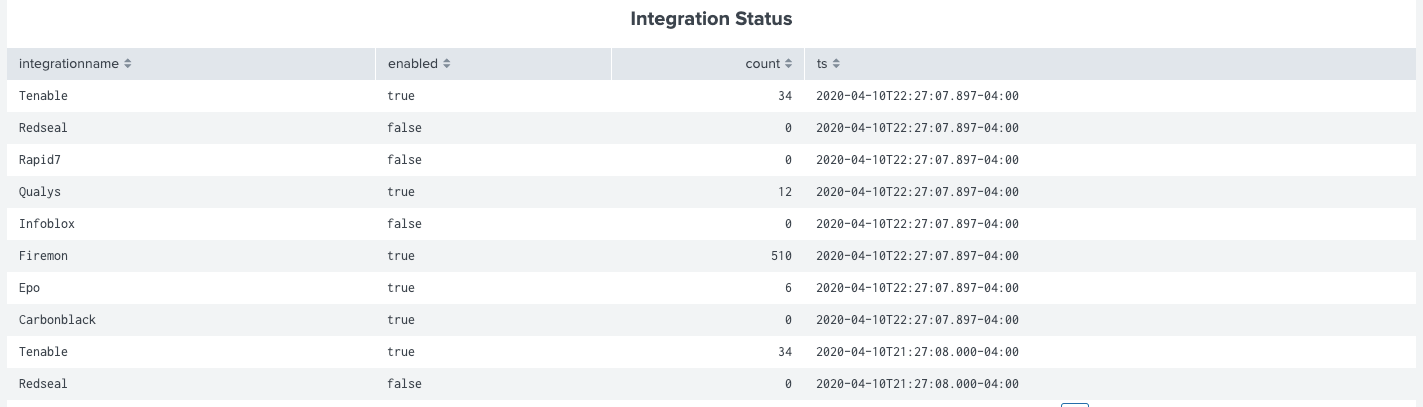
- index=lumeta sourcetype="lumetaapiparser" * |table integrationname enabled count ts|where integrationname not null
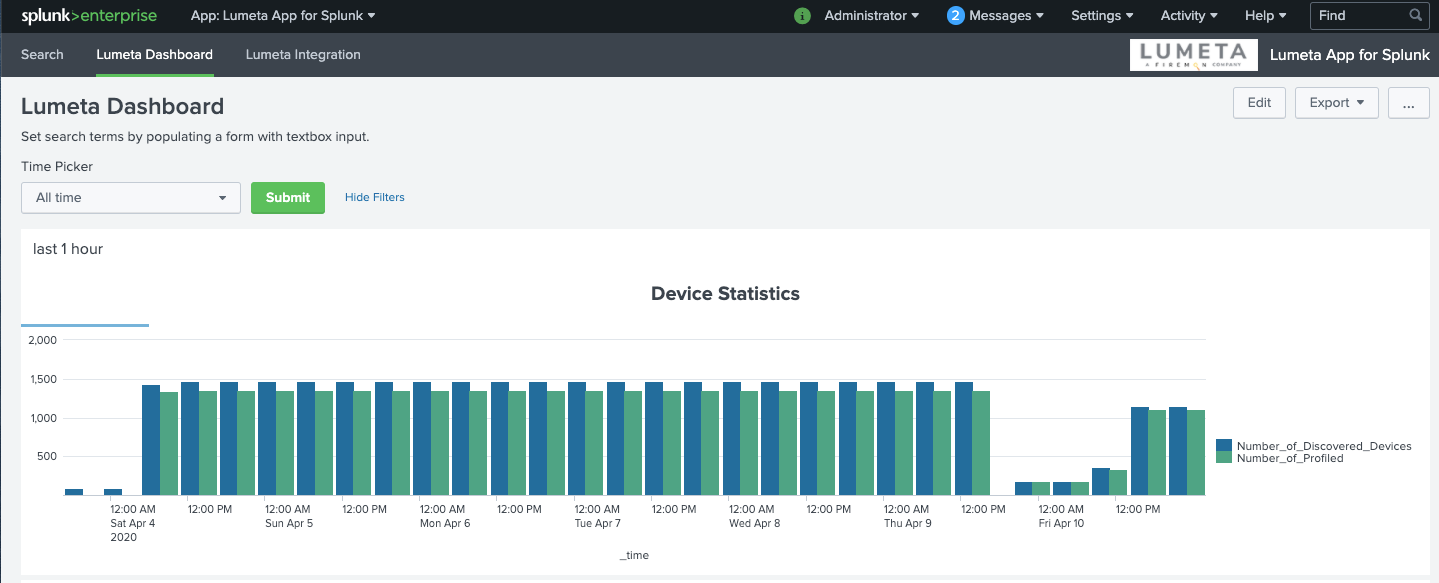
View Dashboards
To view Lumeta dashboards in Splunk:
- On the Splunk Apps page, select Lumeta App for Splunk.
- Click Lumeta Dashboard or Lumeta Integration to view the Dashboards.