...
Asset Manager reports are designed to identify and the list network assets that share a characteristic of interest, or one you name. They provide a tabular display of data pulled from the Lumeta system's database. Reports serve as an important resource for detailed network information.
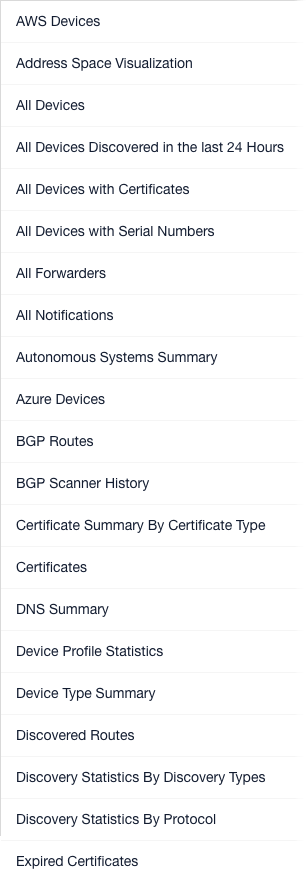
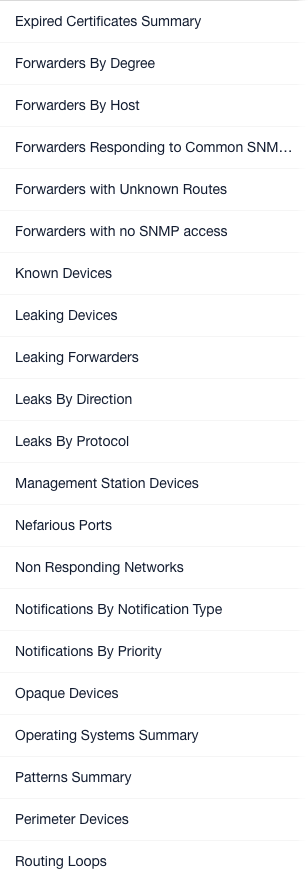
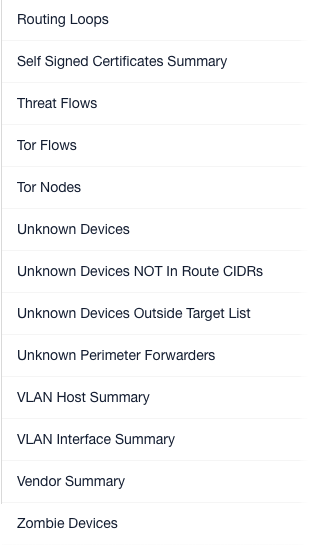
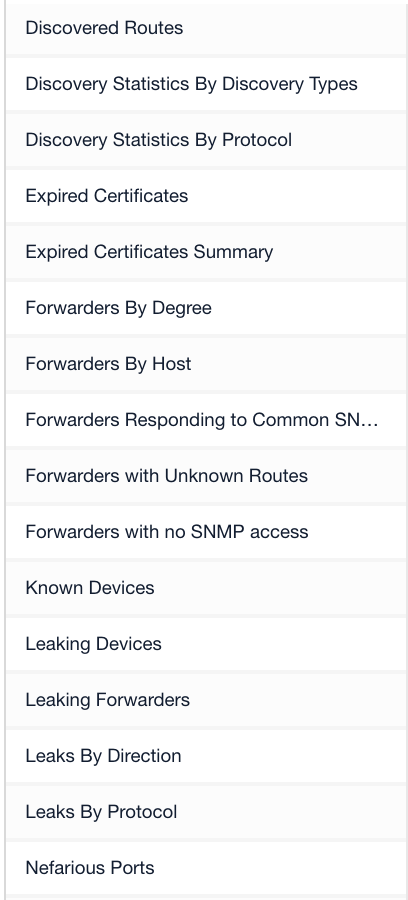
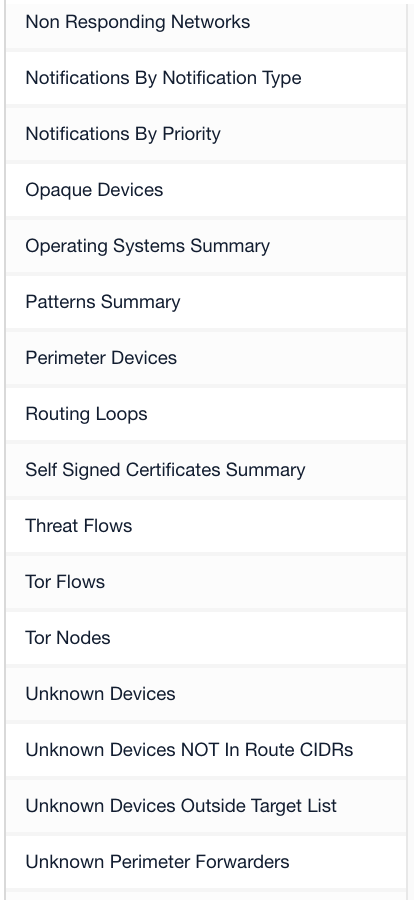
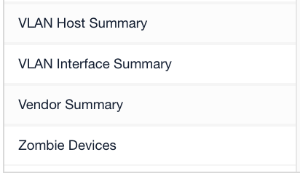
All Asset Manager Reports | ||
|---|---|---|
|
|
|
About Reports
Following are report basics:
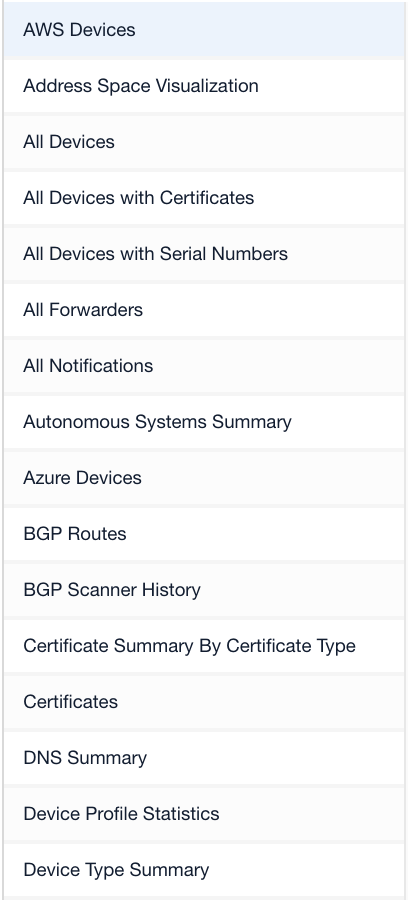
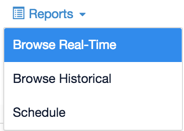
- Reports are available in real-time, which means that the data on the current state of your network is retrieved from Lumeta's data store and immediately displayed on your screen––as soon as screen when you click a report name. If you come back to a displayed report after some time away from your desk, however, you will need to click Refresh to update the report to its real-time state.
- The standard reports delivered with Lumeta Asset Manager reports pertain to one zone . For that you select from the Zone drop-down at the top of the page. If you are interested in a multi-zone viewsor hybrid view of your network, see either the multi-zone views in Dashboards or create a customized report.
- All reports, both standard and customized, are listed alphabetically by name on the left-hand side of the Browse Real-Time page and can be filtered by name using the Search bar.Almost all reports identify a network device's type, operating system, maker, active ports, and the protocols to which it responds.
...
All Lumeta Reports as of 5/3/2020
...
...
...
...
...
- Standard Asset Manager reports
...
- cannot be deleted.
...
- Customized reports––which are those you've added––can be edited or deleted. See Adding & Managing Reports for
...
Most reports include the following device identifiers.
...
Device Type
...
Category of appliance (e.g., general purpose, bridge, broadband router, firewall, hub, load balancer, phone, power device, printer, proxy server, remote management, router, security misc, storage misc, switch, telecom misc, terminal, terminal server, VoIP, WAP, webcam)
...
DNS
...
Domain Name Service
...
IP
...
The Internet Protocol address (e.g., 10.100.50.102)
...
MAC
...
Media Access Control address (e.g., 01:23:45:67:89:ab)
...
Model
...
Typically, an alphanumeric identifier (e.g., ff79ew0e)
...
OS
...
The operating system (e.g., Cisco IOS, Linux, FreeBSD)
...
Router ID
...
The 32 bit number assigned to each router running the OSPF protocol (e.g., ospf routerid 5.1.1.49)
...
Vendor
...
The seller of the device (e.g, Cisco, Juniper, Windows)
...
Version
...
Unique software release number (e.g., Fedora Linux, 15.0, 8.x)
...
- how-to procedures.
- The Browse Historical Reports option allows you to view point-in-time snapshots of your network
...
...
- .
- The Report Scheduler enables you to schedule the running of a particular kind of report, indicate how often the report should run, and whether and who should receive it via email message.
...
- See Scheduling Reports for Distribution for more.
Almost all reports identify a network device's type, operating system, maker, active ports, and the protocols to which it responds. See Universal Device Details for more.
- When you click on a pie slice in a real-time report widget, the adjacent table displays only the data associated with that slice. To return to showing all data for the whole pie, click the "Show Parent" icon.
- For Perimeter Devices and Unknown Perimeter Forwarders reports, the definition of a "perimeter device" is a device's Boolean value for 'perimeter' that is set to <true> based on the existence of traceroute-derived 'links' (device1<->device2) AND (only) one of those two link device's inclusion in the 'Internal' list (manually inputted list of IP's).