Interested in pushing Lumeta syslog notifications to Splunk? This page describes how to make that happen.
Configure Lumeta for Splunk
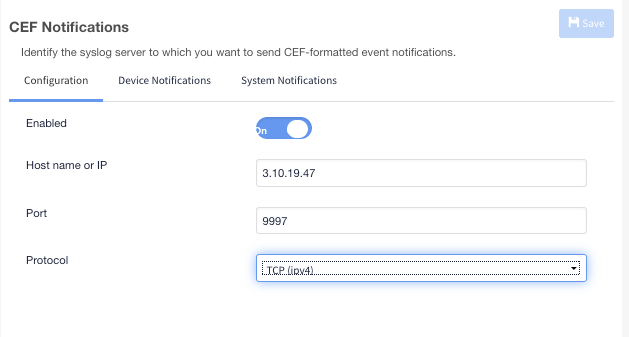
First, configure Lumeta to export notifications to a Splunk server.
On your Lumeta Command Center, browse to Settings > Lumeta Systems.
In the CEF Notifications pane, on the Configuration tab, supply the host name or IP address of your Splunk server, the number of the port you want to communicate over (e.g., 9997) and protocol (e.g., TCP).
Create API Key
You will need an API key later, when configuring Lumeta input on your Splunk server. Generate one using this procedure.
To generate the API key:
...
Installing the Lumeta Plug-In on Splunk
...
...
Configure the Lumeta Application in Splunk
...
https://3.9.250.98/api/rest/report/savedQuery
...
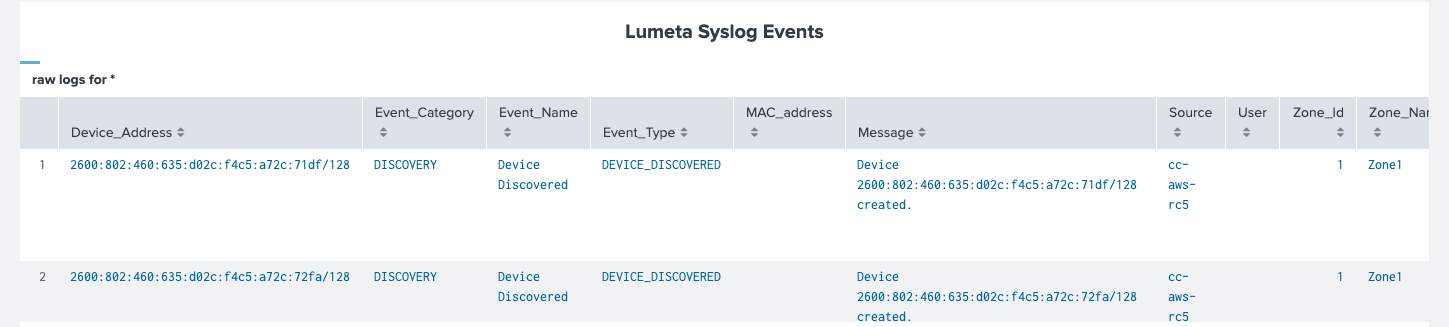
View syslog Data
To view syslog data from Lumeta in Splunk:
- On the Splunk Apps page, select Lumeta App for Splunk.
- Select the Search tab (if you are not there already).
- Enter your search criteria. Examples follow:
- source=”tcp:9997”
- index=lumeta
- sourcetype=”lumeta_log_parser”
- now combine all 3 into one search
- index=lumeta sourcetype=”lumeta_log_parser” source=”tcp:9997”
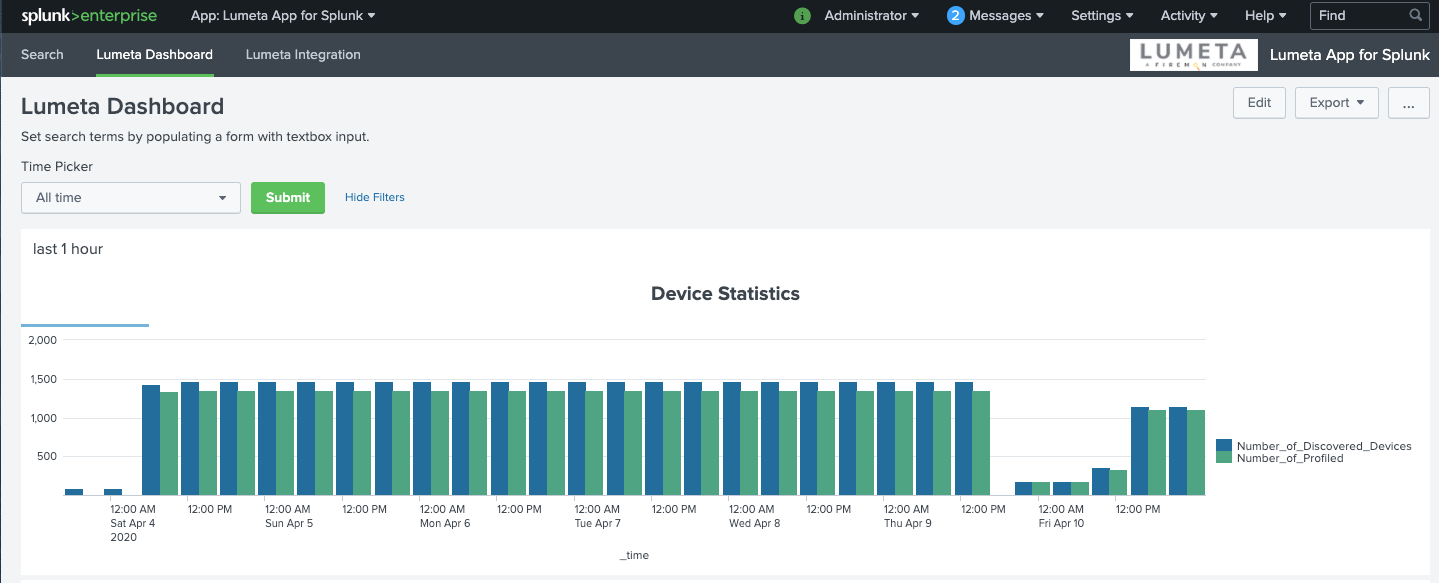
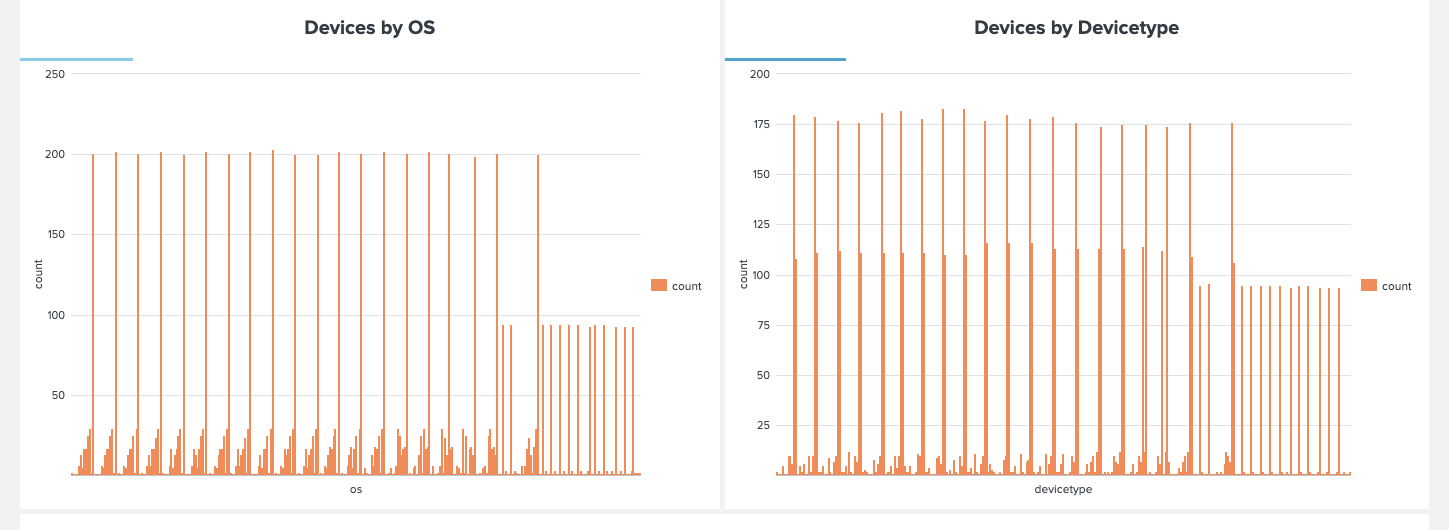
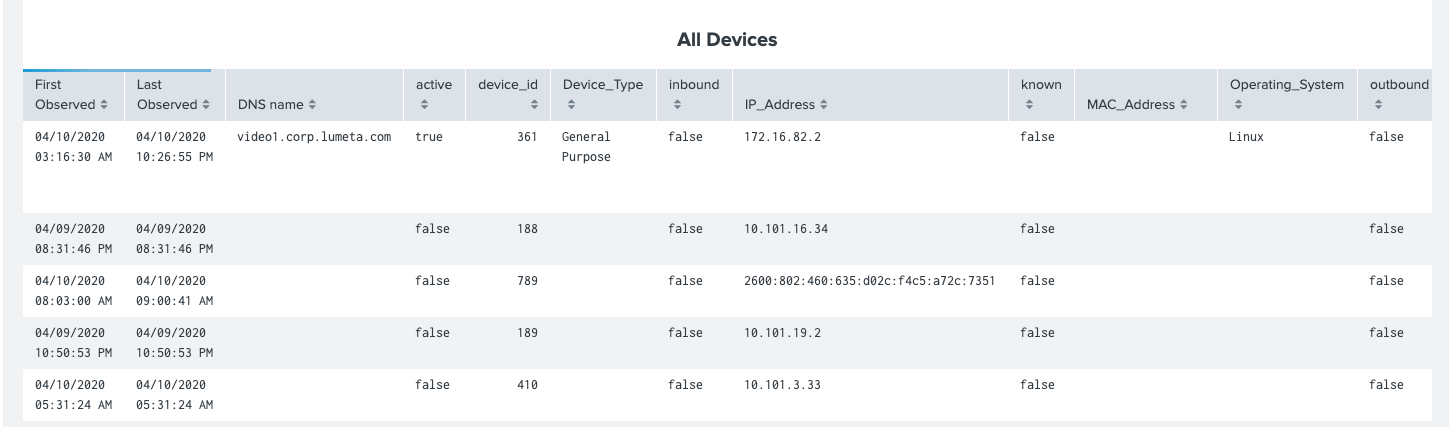
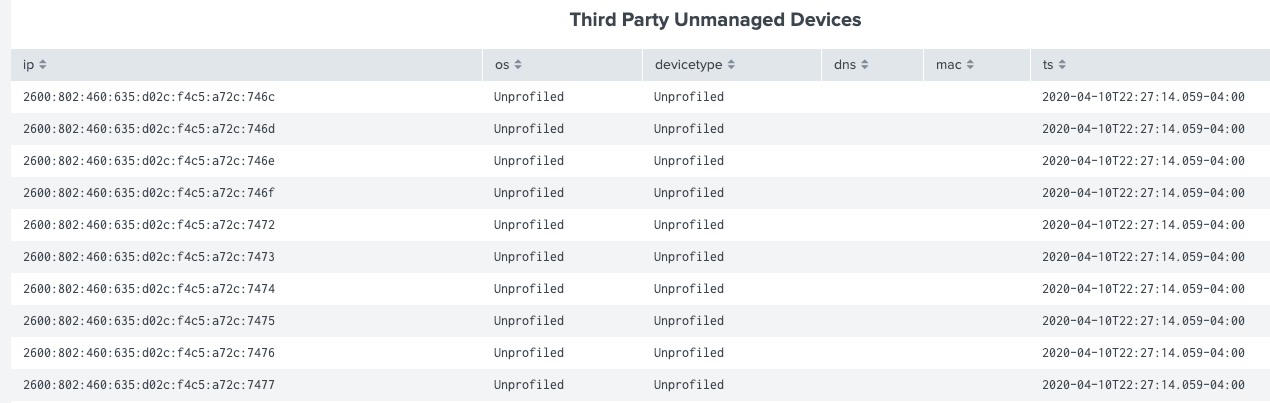
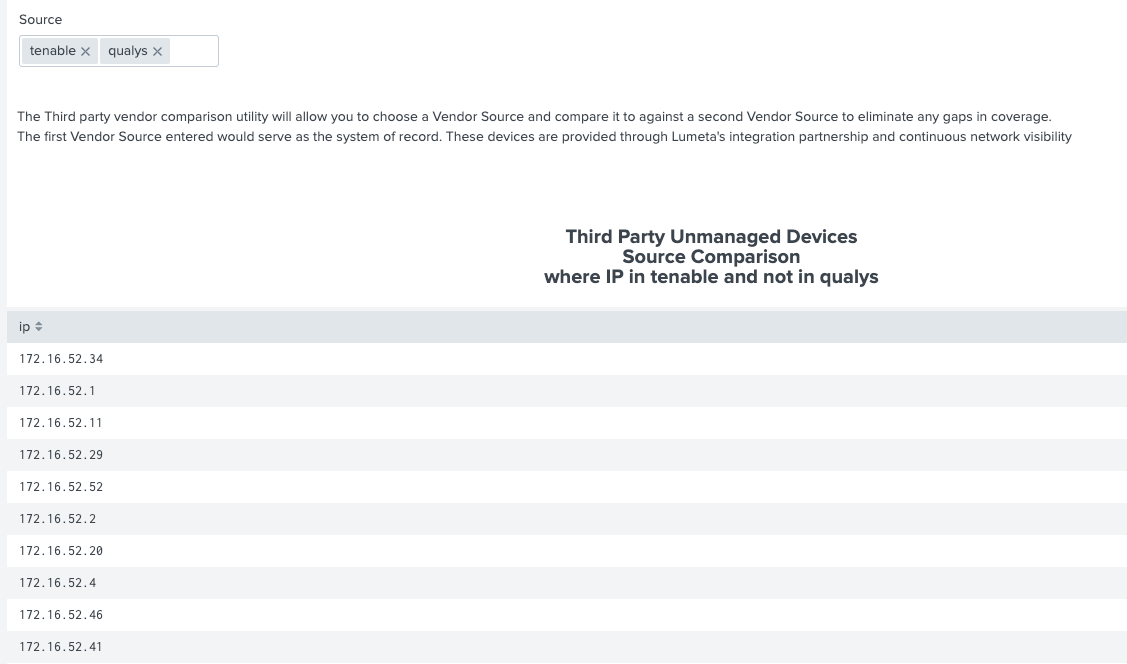
View Dashboards
To view Lumeta dashboards in Splunk:
- On the Splunk Apps page, select Lumeta App for Splunk.
- Click Lumeta Dashboard or Lumeta Integration to view the Dashboards.

...
...
- Log into Splunk.
- Click the Splunk > Enterprise logo on top left to display the Lumeta and Lumeta App for Splunk tabs.
...
| Children Display |
|---|